How to Derive Sales Improvement Strategies from POS Data
We introduce a method for achieving optimal procurement and sales floor layout through objective analysis by AI.

Tool to be Used
- File Analysis Assistant
Optimize Sales and Inventory with a Product Strategy that Doesn't Rely on Intuition
“Sales are concentrated on certain products,” “Some products just don't sell for some reason,” “We're unsure what to stock next.” These are common issues shared by many retailers. A product strategy based on experience and intuition can easily lead to lost sales opportunities and excessive inventory.
In this article, we introduce a concrete method for objectively analyzing POS data with AI to derive sales improvement strategies. By using the "File Analysis Assistant" to optimize purchasing and store layout based on precise data, you can simultaneously achieve sales maximization and improved inventory efficiency.
Concrete Steps
1.Upload Your POS Data to the “File Analysis Assistant”
Upload your POS data file in CSV or Excel format. It is desirable that the data includes fields such as product name, category, date, units sold, and inventory level, and consolidating data over a certain period will enhance the analysis accuracy.
Example: POS data for Store A from January to December 2024. Fields included are “Product Name,” “Category,” “Date Sold,” “Units Sold,” “Inventory Level,” and “Unit Price.”
2.Input the Content You Want Analyzed
Clearly tell the AI what you want it to analyze from the uploaded POS data.
Ask questions according to your objectives, such as best sellers, inventory efficiency, seasonal factors, or purchasing trends.
Prompt Example:
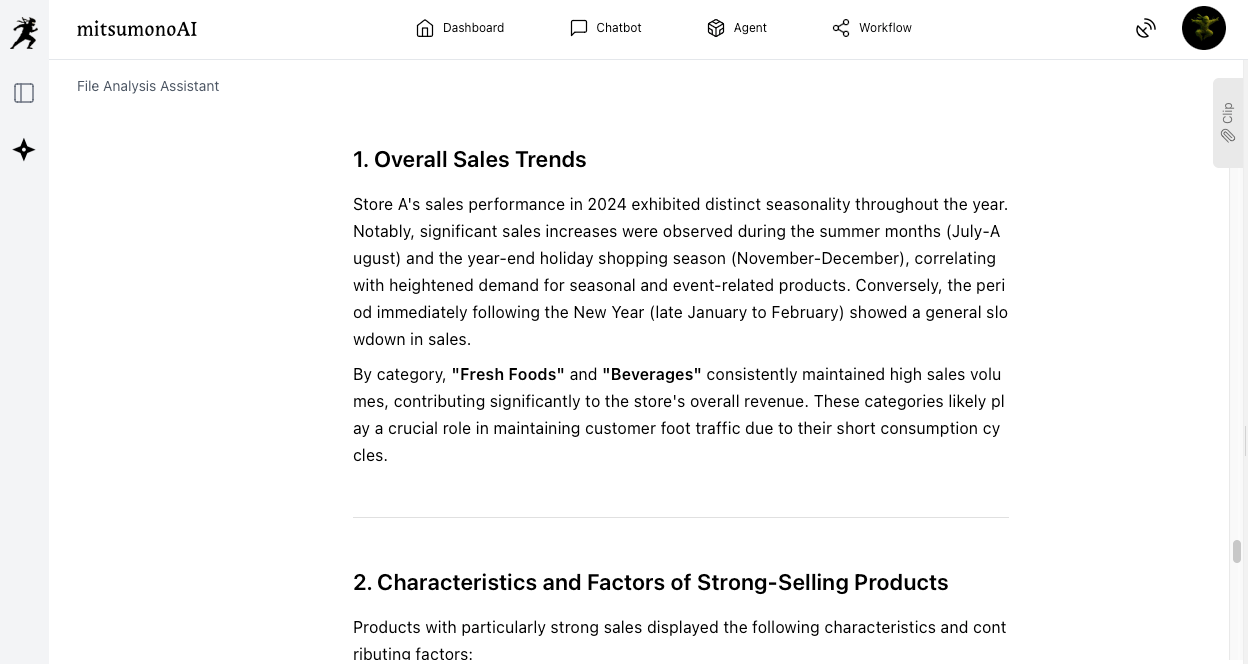
“Tell me the characteristics of products with strong sales and those with weak sales.”
“Please list the top 3 best-selling products for each category.”
“Organize the 2024 sales trends by season (Spring, Summer, Autumn, Winter).”
“Based on past sales data, propose a guideline for the quantity to be stocked in 2025.”
3.Examine Purchasing and Store Layout Strategies Based on the Analysis Results
Based on the output analysis, materialize specific plans for product-specific purchasing policies, inventory adjustments, and a review of in-store display locations.
By asking the AI again for “improvement suggestions” or “specific layout ideas” as needed, you can develop practical strategies.
Prompt Example:
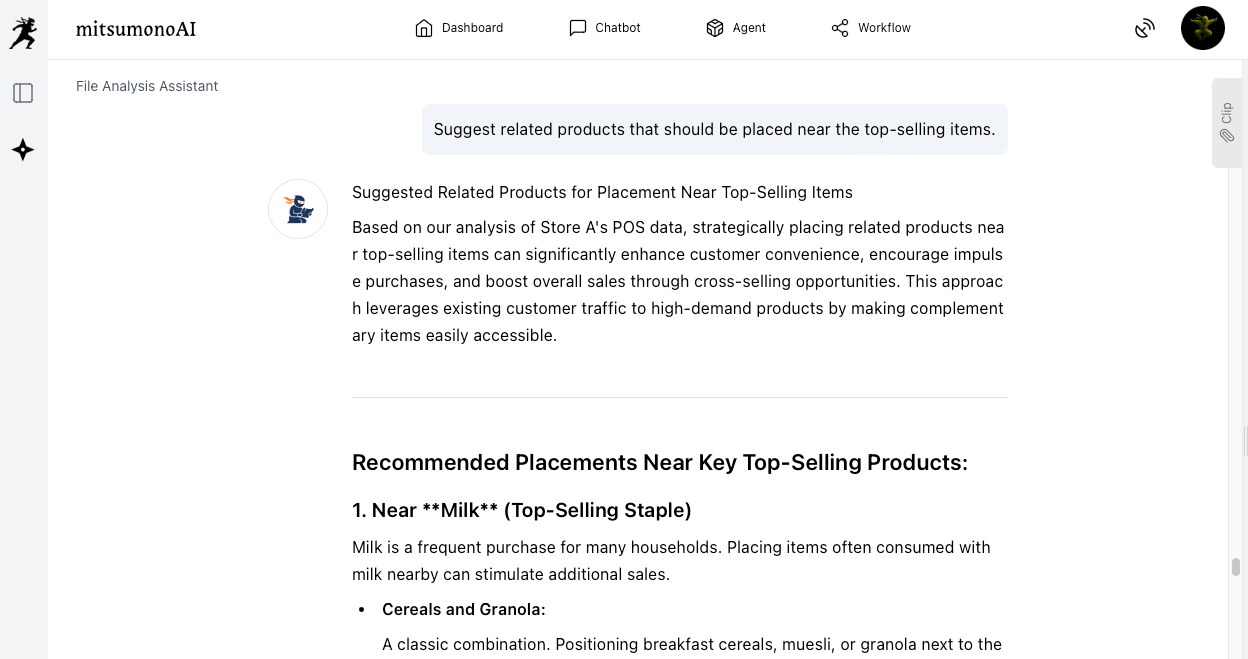
“Suggest related products that should be placed near the top-selling items.”
“Give me advice on layout improvements based on the customer flow path.”
Goals Achieved Through Utilization (Reference Examples)
Objectively analyzing POS data with AI clarifies sales trends and purchasing patterns for each product. This enables the optimization of purchasing plans and store layouts based on data, not just experience or intuition. As a result, it contributes to overall store sales improvement and inventory optimization.
Target Figures for the 6-Month Period Following Implementation
KGI (Key Goal Indicator):
Average monthly store sales: 7% increase from the current level
KPIs (Key Performance Indicators):
・Average monthly store gross profit margin: 2 percentage point increase from the current level
・Product inventory turnover rate: 10% increase from the current level
・Sales contribution of the top 20% best-selling products: 5 percentage point increase from the current level